 Tencent Holding Limited (700.HK) is China’s largest internet company with a portfolio including some of China’s most successful internet services such as instant-messaging services QQ and WeChat, each with more than 600m active users. Tencent is on its way to close a deal to invest 1bn USD in the Meituan-Dianping, a joint venture backed from two startups in the area of group-buying services (similar to Groupon) and restaurant-review (similar to Yelp).
The platform connects mobile users to brick-and-mortar services. Both competing startups have recently joined forces to control together now about 80% of Chinese’s O2O (on-to-offline) market. Before, every player was sacrificing profits in exchange for scale. O2O commerce has become the main battleground for China’s big technology companies. The market grew about 80% on the year to 48.2bn USD in the first half of 2015.
The Meituan-Dianping joint venture could value up to 20bn USD, which would make it the most valuable startup in the world. The deal is in line with Tencent’s broader strategy of using alliances with other tech companies to offer a wider range of services through its social-networking applications.
After China internet companies has been well protected from outside competition, the local internet industry starts now to consolidate among the most powerful players Tencent, Alibaba and Baidu in order to build more dominant businesses and to reduce costs. All three are spending large amounts of money to acquire startups that connect smartphone users with offline local services such as food delivery, taxi rides, movie tickets and leisure deals.
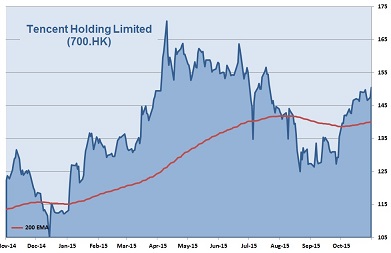
Listed in Hong Kong since June 2004, Tencent’s value has increased more than 17,300%. The stock is currently valued 45 times its profit which is not too high for a tech company with an average EPS growth of 30%. 31 out of 37 analysts rate the stock with outperform or buy. The chart looks technically sound. I expect new highs already by December.
Asia Investment Signals’ Rating: ★★★★☆
| 2011 | 2012 | 2013 | 2014 | 2015e | 2016e | |
|---|---|---|---|---|---|---|
| EPS | 1.1 | 1.37 | 1.66 | 2.55 | 3.28 | 4.26 |
| Change | 25% | 21% | 54% | 29% | 30% | |
| P/E current: | 37 | |||||