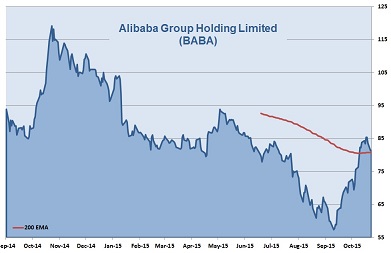
 Alibaba Group Holding Limited (BABA) will be part of the MSCI emerging market index from Dec 1. The world’s biggest e-commerce company is listed since September 2014 at the NYSE. An IPO pricing of 25bn USD made the company the largest IPO in history. With a first day closing price at 93.89 USD, Alibaba has reached a market value of 231bn USD. Since then, the stock has traded down to 57.39 USD end of September 2015, a market cap of only 145bn USD.
China based Alibaba Group provides C2C (Taobao), B2C and B2B sales services via web portals. It also provides electronic payment services (Alipay), a shopping search engine and data-centric cloud computing services. A milestone this year has been Alibaba’s expansion into India’s mobile payments and e-commerce space in February with a 25% stake in Paytm owner One97. India is potentially as big as Alibaba’s market in China and could be another growth story for the company in the near future.
The Alibaba Group reported sales of 12.3bn USD for its last fiscal year ending on March 2015. Analysts expect more than 15bn USD in sales for 2016 and 20bn USD for 2017. EPS is expected to grow at similar rates of 17% for 2016 and 30% for 2017. 38 out of 44 covering analysts rated the company with outperform and buy.
At a current price of 79.85 USD the stock is valued 21 times its earnings, which is in line with the industry P/E. But the Web giant’s growth has been slowing recently. The value of goods sold across its platforms increased by 28 % to 112bn USD in the three months to September, the slowest pace in over three years. A spectacular China’s Single Day sales of 14.3bn USD did not give the stock much boost. We do not really expect Alibaba’s stock to rally towards the end of this year. But we like the technical picture with the stock just crossing above its 200 moving average. Further signals could make this stock worth to keep it on the watchlist in the next time.
Asia Investment Signals’ Rating: ★★★★☆
| 2013 | 2014 | 2015 | 2016e | 2017e | |
|---|---|---|---|---|---|
| EPS | 0.6 | 1.6 | 2.3 | 2.7 | 3.5 |
| Change | 184% | 41% | 17% | 30% | |
| P/E current: P/E Industry: |
21 20 |