 PT Colorpak Indonesia Tbk (CLPI.JK) is a small manufacturer of printing ink for flexible and cigarette packaging in Indonesia. The company trades furthermore films, adhesives, plastic resins and printing equipment. Colorpak Indonesia has two manufacturing facilities in Indonesia and sells its products to the domestic market as well as to Australia and China.[mepr-active membership=”1734″ ifallowed=”show” unauth=”message” unauth_message=”Please login or purchase a membership to view full text.”] The major customer accounts for about 13% of the company’s net sales.
Colorpak Indonesia was founded in 1988 and is headquartered in Jakarta, Indonesia. Its shares are listed on Jakarta’s Stock Exchange since 2001. Around 51% of the shares are owned by Ink Color International Pte. Ltd Singapore, 27% of the shares are traded publicly.
With a workforce of only 82 employees, Colorpak Indonesia reported revenues of 649bn IDR (49m USD) and a profit before tax of 85bn IDR (6m USD) for 2016. This is an increase of 2% and 47% respectively compared the year ago. In 2015, revenues and profits were both down 26% compared to the year before. The operating margin of around 13% is well above industry average. Colorpak Indonesia’s cash reserves at the end of 2016 have been 106bn IDR (8m USD). The company shows a healthy balance sheet with an equity ratio of 76% and a low gearing, defined here as total liabilities to total equity, of 32% only.
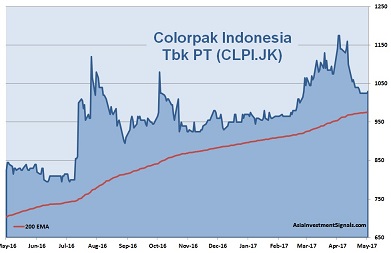
Colorpak Indonesia’s shares are in an uptrend since September 2015 and gained more than 90% in value since, 10% alone this year. The company is currently priced at only five times earnings, compared to 37 times among its sector peers. The shares trade below book value and at only four times cash flow. The last dividend payment yielded 3.8%.
We like this small company due to its strong balance sheet with little debts only, its profit growth rate of nearly 20% over the past five years, and its relatively low valuation. The chart looks promising with a recent buy signal from its MACD indicator. A price increase of 20% until the end of this year should be very likely.
AIS Rating: ★★★★☆
| 2011 | 2012 | 2013 | 2014 | 2015 | 2016 | |
|---|---|---|---|---|---|---|
| EPS (IDR) | 90.6 | 96.6 | 75.7 | 197.8 | 137.8 | 208.3 |
| Change | -3% | 7% | -22% | 161% | -30% | 51% |
| P/E | P/E SECTOR |
P/B | P/CF | Equity Ratio* |
ROE | Debt/ Equity** |
Div YLD |
|---|---|---|---|---|---|---|---|
| 5 | 37 | 0.7 | 4 | 76% | 16% | 32% | 3.9% |
* Equity / Total Assets, ** Total Liabilities / Equity
[/mepr-active]
