 Captii Limited (AWV.SI) is an investment holding that engages in the mobile telecom and technology markets of South East Asia, South Asia, and the Middle East. The company offers solutions to leading telecom service providers with platform and application systems, managed services, system integrations, software adaptations, and project management.[mepr-active membership=”1734″ ifallowed=”show” unauth=”message” unauth_message=”Please login or purchase a membership to view full text.”] The company comprises of three business segments: Unifiedcomms, GlobeOSS, and Captii Ventures.
Unifiedcomms is a leading provider of software applications and systems that power value-added-services and optimizes the performance of mobile network operator. Unifiedcomms has a staff of over 180 employees and addresses more than 500 million subscribers of 32 mobile network operators in 15 countries across South East Asia, South Asia, the Middle East and Africa.
GlobeOSS specializes in extracting network transactional data and turning them into valuable benefits and applications for the telecoms service providers. GlobeOSS has more than 100 engagements with various telecom operators and enterprises in Asia Pacific.
Captii Ventures is the newest business segment since 2015 that was established to undertake strategic investment in early and late-stage technology ventures in Southeast Asian. The portfolio comprises currently of ten start-ups engaged in enterprise application services, marketplaces, and digital media.
The telecom market across Asia has an estimated total of 4.2bn mobile subscribers. While revenues for core services (voice and messaging) are declining, operators are focusing on new generation platforms and increased data usage driven by value-added services and increased ARPU. This is where Captii’s products and services are well positioned.
Captii Ltd, formerly known as Unified Communications Holdings Ltd, was founded in 2002 and is listed on the Main Board of the Singapore’s Stock Exchange. The company is headquartered in Singapore but has its operational headquarter in Malaysia, where most of its staff is located. 60% of the company is owned by Worldwide Matrix Sdn Bhd and RHB Securities Singapore Pte Ltd. 34% of the shares are in public hand.
With a workforce of 161 employees, Captii reported revenues of 5m SGD (3.7m USD) and a profit before tax of 0.8m SGD (0.6m USD) in its first quarter 2017. This is an increase of 27% and 78% respectively compared to the same period a year ago. In 2016, revenues were up 22% and 89% respectively compared to the year before. The average operating margin over the last five years of 23% is below industry average. Captii had a cash reserve of 9m SGD (6.7m USD) at the end of March 2017. The company shows a solid balance sheet with an equity ratio of 81% and a gearing, defined here as total liabilities to total equity, of only 24%.
The strong growth is due to improved market conditions since the second half of 2016, especially for GlobeOSS. System sales, where the customers purchase a product or technology outright, have improved significantly. The more profitable managed service contracts with stable recurring revenues, on the other hand, are lacking behind company’s expectations.
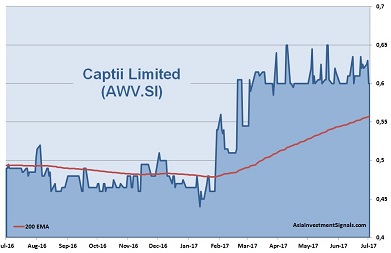
Captii shares are in an uptrend since February this year and gained 42% in value since. The shares seem to test an upper resistance line at around 0.6 SGD, which limited the price since 2009. The company is currently priced at only four times earnings compared to 27 times among its sector peers. The shares trade well below book value and at three times cash flow only. The last dividend payment yielded 4%.
The company is solid financed and showed nine consecutive years of profitability. The declining number of managed services contracts can be a risk for the company’s profitability and the generation a steady income stream. Telecom technologies are rapidly growing and are changing permanently. We believe in the ability of the company to keep up with the trends by finding new growth opportunities in current or new business segments.
AIS Rating: ★★★★☆
| 2011 | 2012 | 2013 | 2014 | 2015 | 2016 | 2017 Q1 only |
|
|---|---|---|---|---|---|---|---|
| EPS (SGDcents) | 6.0 | 18.6 | 3.2 | 6.8 | 8.1 | 16.7 | 1.28 |
| Change | -8% | 210% | -83% | 111% | 19% | 107% | 75% |
| P/E | P/E SECTOR |
P/B | P/CF | Equity Ratio* |
ROE | Debt/ Equity** |
Div YLD |
|---|---|---|---|---|---|---|---|
| 4 | 28 | 0.6 | 3 | 81% | 16% | 24% | 4% |
* Equity / Total Assets, ** Total Liabilities / Equity
[/mepr-active]
