 Tencent Holdings Ltd (0700.HK) is the largest provider of internet services in China and the most valuable firm listed in Asia. To continue the superlatives: Tencent is the world’s largest online gaming provider in the world’s biggest gaming market. The company has a leading position in PC and mobile gaming, social networks, and online advertisement.[mepr-active membership=”1734″ ifallowed=”show” unauth=”message” unauth_message=”Please login or purchase a membership to view full text.”] 95% of the company’s revenue is generated in China, and more than 70% of the revenue comes from social network and online gaming subscriptions. Two of Tencent’s services, Weixin and WeChat, have combined 960m users monthly. Their best selling online game ‘Honor of Kings’ boosts around 80m users daily. Tencent’s numerous business models, as well as the many participations in Asia’s tech market, makes it a well-diversified tech company.
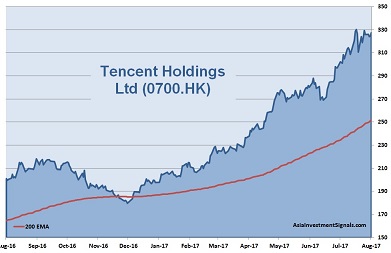
Tencent has been one of our first recommendations since this blog went online (see: Tencent – Ahead of the O2O Game). Since then, the stock has increased 116% and did not show any signs of fatigue. Tencent’s performance is underpinned by strong growth in almost all of the company’s segments. The latest results surprised even the analysts with the highest expectations.
Tencent was founded in 1998 and is headquartered in Shenzhen, China. The shares are listed on the main board of Hong Kong’s Stock Exchange since 2004 and can also be traded in the US, in Germany, and in Mexico. Major shareholder is MIH TC, a Naspers Ltd controlled company, with an ownership of 33%, followed by Tencent’s core founder and chairman, Ma Huateng, with an ownership of around 9%. 58% of the shares are in public hand.
With a workforce of almost 39,000 employees, Tencent reported revenues of 106bn RMB (16bn USD) and profit before tax of 40bn RMB (6bn USD) over the first half year 2017. This is an increase of 57% and 59% respectively compared to the same period a year ago. In 2016, revenues and profits increased 48% and 43% respectively. The operating margin of 39% is well above industry average. Tencent had cash reserves of 70bn RMB (11bn USD) at the end of June 2017. The company shows a solid balance sheet with an equity ratio of 49% and a gearing, defined here as total liabilities to total equity, of 106%. Moody’s rates the company with A2 and gives a positive outlook.
Tencent’s shares came a bit under pressure recently after its widely popular game ‘Honor of Kings’ was criticized by China’s government as harmful to young players. China’s cyberspace administration also announced an investigation into some tech companies for cyber security violations. But it is hard to believe that there will be many limitations coming from the government’s side. China’s top tech companies are prestige companies for the economy, and some of their founders are well connected with the political elite.
Tencent gained almost 37,000% since its first trading in 2004 and is up more than 70% this year alone. The company is priced at 49 times earnings. The shares trade at 12 times book value and at 36 times cash flow. The company pays only a small dividend, yielding less than 1%. The majority of covering analysts rate the stock as an outperformer.
Tencent’s current growth drivers will at some point in time reach the peak of their product life cycle. All depends on the future innovative power of Tencent to release new blockbuster and to generate income streams from new services. The company plans already to increase investments in payment and cloud services as well as in artificial intelligence to enhance benefits in existing business. It is also likely that Tencent is looking for further growth opportunities outside China. Southeast Asia, with its population of around 625m, is a market where Tencent is already a highly active investor.
We are optimistic that Tencent will stay ahead of the game for at least another 3-5 years even with smaller growth rates. Setbacks after less favorable quarterly results are very likely and buy opportunities. The company remains an absolute base investment in the Chinese tech sector for the long term oriented investor.
AIS Rating: ★★★★☆
| 2011 | 2012 | 2013 | 2014 | 2015 | 2016 | 2017 Q1 only |
|
|---|---|---|---|---|---|---|---|
| EPS (RMB) | 1.1 | 1.4 | 1.7 | 2.5 | 3.1 | 4.3 | 3.4 |
| Change | 27% | 24% | 21% | 53% | 20% | 42% | 63% |
| P/E | P/E SECTOR |
P/B | P/CF | Equity Ratio* |
ROE | Debt/ Equity** |
Div YLD |
|---|---|---|---|---|---|---|---|
| 49 | 1723 | 12 | 36 | 49% | 30% | 106% | 0.2% |
* Equity / Total Assets, ** Total Liabilities / Equity
[/mepr-active]
