 Great Eastern Holdings Ltd (G07.SI) is the oldest and largest life insurance company in Singapore and Malaysia. The company also operates in Indonesia, Brunei, China, and Myanmar. It has 64bn USD in assets and over 4m policyholders.[mepr-active membership=”1734″ ifallowed=”show” unauth=”message” unauth_message=”Please login or purchase a membership to view full text.”] Great Eastern distributes its products through a 20,000 strong sales force and a tied partnership with its parent company OCBC Bank. OCBC is Singapore’s oldest bank and the second largest financial group in Southeast Asia by assets. It is ranked among the top 50 safest banks in the world. OCBC has more than 610 branches and rep offices in 18 countries with key markets in Singapore, Malaysia, Indonesia and Greater China.
Great Eastern generates currently more than 70 percent of its revenues from its life insurances business in Singapore. The Malaysia operation accounts for 24 percent, while the rest of Asia contributes to only one percent of the total revenues. Great Eastern plans to expand its focus on Indonesia, South East Asia largest economy with over 260m people. The company targets to become one of the top 10 insurers in the country in the next five years. The bancassurance channel of OCBC’s with over 330 branches in Indonesia will give Great Eastern a strong competitive edge.
Great Eastern was founded in 1908 and is headquartered in Singapore. The shares are listed on the main board of Singapore’s stock exchange since 1999. The company’s shares can also be traded in the US. Major shareholder is the OCBC Bank with an ownership of around 88 percent. Roughly 9 percent of the shares are in public hand only.
With a workforce of more than 2,800 employees, Great Eastern reported revenues of 1.4bn SGD (1.1bn USD) and profits before tax of 1.3bn SGD (988m USD) in 2017. This is an increase of 77 and 86 percent respectively compared to the same period a year ago. In 2016, revenues and profits decreased 20 and 21 percent respectively. The operating margin of 92 percent is well above industry average. Great Eastern had cash reserves of 5.4bn SGD (4.1bn USD) at the end of 2017. The equity ratio is at 9 percent only and the gearing, defined here as total liabilities to total equity, at more than 1,000 percent. Nevertheless Standard & Poor’s credit rating of Great Eastern is AA- with a stable outlook since 2010, one of the highest among Asian life insurance companies.
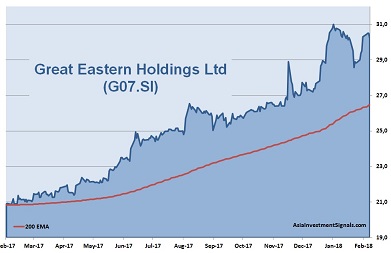
Great Eastern’s shares are in an uptrend since January 2017 and gained almost 50 percent in value since, ten percent alone this year. The company is priced at 13 times earnings. The shares trade at twice the book value and at roughly three times cash flow. The latest dividend yielded 1.6 percent. Only one analyst is covering the company and rate the stock as a hold.
Great Eastern shows a bit of inconsistent profitability and weak financials. Nevertheless, the insurer is under the wings of a very solid bank. The long-term outlook for life insurance products in South East Asia is more than promising due to the sheer population size, rising income and wealth, and due to a significant protection gap. Life premiums are expected to grow around 10 percent in 2018 and 2019. Promising also, Great Eastern’s plans to strengthen its focus in Indonesia. The country is one of the fastest growing nations in Asia with an insurance penetration rate of only 2 percent, the lowest in South East Asia.
Due to a regulatory change for foreign ownership in Malaysia, Great Eastern will most likely cash in about 1bn USD this year with the sale of a minority stake of 30 percent of its Malaysia operation. Another positive development for insurance companies, in general, is the rising interest rates which lead to better yields for invested insurance premiums.
With continuing stable economic growth ahead in the region, we expect Great Eastern’s share to increase another 15 to 20 percent this year.
AIS Rating: ★★★☆☆
| 2012 | 2013 | 2014 | 2015 | 2016 | 2017 | |
|---|---|---|---|---|---|---|
| EPS (SGD) | 2.5 | 1.4 | 1.9 | 1.7 | 1.3 | 2.4 |
| Change | 210% | -43% | 30% | -11% | -25% | 95% |
| P/E | P/E SECTOR |
P/B | P/CF | Equity Ratio* |
ROE | LIAB./ Equity** |
Div YLD |
|---|---|---|---|---|---|---|---|
| 13 | 21 | 2 | 2 | 9% | 16% | 1008% | 1.6% |
* Equity / Total Assets, ** Total Liabilities / Equity
[/mepr-active]
