 Xiwang Special Steel Company Ltd (1266.HK) is one of the leading manufacturers for ordinary and high-end special steel in China. The company manufactured 3m tons of steel products last year which are used in buildings, infrastructures, and automobiles as well as in the shipbuilding, chemical, and petrochemical, machinery and equipment industry.[mepr-active membership=”1734″ ifallowed=”show” unauth=”message” unauth_message=”Please login or purchase a membership to view full text.”] Xiwang Special Steel trades raw materials such as iron ore dust, pellet, steel billets and coke furthermore.
The company’s ordinary steel business grew last year by 77 percent and accounted for 61 percent of the company’s revenues. The special steel business grew by 39 percent and generated around 21 percent of the revenues. The trading business grew by 49 percent and made up 16 percent of the revenues. Xiwang Special Steel’s fourth business segment, the sale of by-products such as steel slag, steam, and electricity, accounted for roughly 3 percent of the revenues only. Xiwang Special Steel generates all its revenue in China. No single customer amounts for more than 10 percent of the revenue.
Xiwang Special Steel was founded in 2003 and is headquartered in Binzhou, China. The shares are listed on the main board of Hong Kong’s stock exchange since 2012. The company’s shares can also be traded in Germany. Xiwang Special Steel is a subsidiary of Xiwang Investment. Major shareholder is the Wang family with an ownership of 67 percent. The balance is held by the public.
With a workforce of around 4,300 employees, Xiwang Special Steel reported revenues of 12bn RMB (1.9bn USD) and profits before tax of 1.1bn RMB (173m USD) in 2017. This is an increase of 63 and 159 percent respectively compared to the same period a year ago. For the first quarter of 2018, the company expects net profit to increase by 26 percent. In 2016, revenues and profits increased 12 and 122 percent respectively. The operating margin of 12 percent is about industry average. Xiwang Special Steel’s cash reserves increased by 23 percent to 126m RMB (20m USD) at the end of December 2017. The company shows a balance sheet with good profitability, but only acceptable financial strength. The equity ratio is at 41 percent and the gearing, defined here as total liabilities to total equity, at 146 percent. Next results will be announced in August.
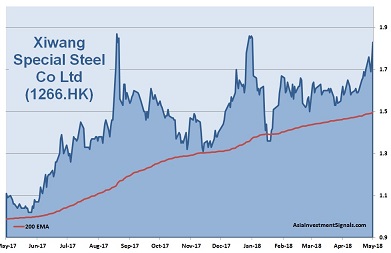
Xiwang Special Steel’s shares are in an uptrend since July 2016 and gained more than 160 percent in value since, 13 percent alone this year. The company is priced at four times earnings only. The shares trade below book value and at 1.5 times cash flow only. The forward dividend yields almost nine percent. The two covering analysts rate the company as a buy or outperformer.
The company shows a balance sheet with good profitability, but only acceptable financial strength. The valuation is currently very low. The industry outlook for China’s steel market this year is only moderate with an expected growth rate of 0.6 percent. The Chinese government managed to reduce the capacity of inefficient and dirty mills. This will have a positive impact on the steel market and restore the balance after years of oversupply.
Xiwang Special Steel seems to be well positioned in this stronger regulated steel market. The company invested 2.55bn RMB in the construction of a new production line for rail steel which is expected to commence supply ina first phase in 2019. A second phase is expected to be completed in 2020.
Xiwang Special Steel’s revenues and profits grew by 8 and 25 percent respectively over the past three years. Assuming a stable global economy with a moderate increase in interest rates, we expect the share price to increase 20 to 30 percent over the next 12 months.
AIS Rating: ★★★★☆
| 2012 | 2013 | 2014 | 2015 | 2016 | 2017 | |
|---|---|---|---|---|---|---|
| EPS (RMBcents) | 17.8 | 19.2 | 20.3 | 8.4 | 15.8 | 41.9 |
| Change | -69% | 8% | 6% | -58% | 87% | 166% |
| P/E | P/E SECTOR |
P/B | P/CF | Equity Ratio* |
ROE | LIAB./ Equity** |
Div YLD |
|---|---|---|---|---|---|---|---|
| 4 | 27 | 0.6 | 1.5 | 41% | 20% | 146% | 9% |
* Equity / Total Assets, ** Total Liabilities / Equity
[/mepr-active]
