 BeiGene Ltd (BGNE) is a commercial-stage, research-based biopharmaceutical company and one of the leading players in China’s booming biotech market. The company develops and markets next-generation molecularly targeted and immuno-oncology drugs for cancer treatment.[mepr-active membership=”1734″ ifallowed=”show” unauth=”message” unauth_message=”Please login or purchase a membership to view full text.”]
BeiGene has developed four clinical-stage therapies designed to boost patients’ immune system in the fight against cancer. The company, which has a broad presence in the US and China, has currently three products already marketed and 12 pivotal trials ongoing for three late-stage assets. BeiGene has a commercial-scale small molecule and pilot-scale biologics manufacturing facility in Suzhou and is building a 24,000L state of the art commercial-scale biologics manufacturing facility in Guangzhou. Its staff includes more than 200 Ph.D. holders, more than a quarter of them with overseas education experience.
BeiGene has licensing and co-development agreements with Merck Serono, Boehringer Ingelheim, Celgene, and Mirati Therapeutics for the mutual marketing of their products inside and outside China. The partnership with Celgene marks the biggest overseas licensing of drugs developed in China to date and combines their geographical strength to ensure a broader reach to patients.
China has currently the second largest pharmaceutical market in the world with a forecasted annual growth rate of more than 9 percent over the next years. Significant regulatory reforms provide access to more than twice the cancer patients accessible for global development as in the EU and US. China not only wants to catch up with the major pharmaceutical and biotech markets in the world but also wants to establish a competitive healthcare system in the country.
BeiGene was founded in 2010 and is headquartered in Beijing, China. The shares are listed on the NASDAQ since February 2016. The company’s shares can also be traded in Germany. Major shareholder is Baker Bros. Advisors LP, a well-known biotech investor in the US, with an ownership of around 22 percent, followed by Hillhouse Capital Management Ltd with an ownership of about 10 percent. The co-founder and CEO, John V. Oyler, holds about 10 percent in the company. Around 12 percent of the shares are in public hand.
With a workforce of over 1,100 employees, BeiGene reported revenues of 33m USD and losses before tax of 109m USD during its first quarter 2018. In 2017, revenues increased by more than 200 times to 238m USD while losses were cut by a fourth to 91m USD. BeiGene generated around 58 percent of its revenue in the US last year. The Chinese market accounted for about 10 percent of the revenues. BeiGene’s cash reserves more than doubled during the first quarter this year to 491m USD. The company shows a stable balance sheet with good financial strength. The equity ratio is at 80 percent and the gearing, defined here as total liabilities to total equity, at 26 percent. Next results will be announced mid of August.
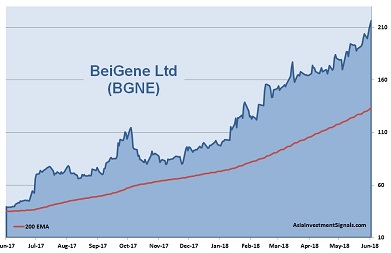
BeiGene’s shares gained strong momentum in 2017 and increased by more than 600 percent in value since, 122 percent alone this year. The shares trade currently at nine times book value. The majority of covering analysts rate the stock as an outperformer with price targets up to 230 USD.
The company is well positioned in a strong competitive environment. BeiGene combines a world-class clinical development team of more than 300 persons and an experienced commercial team of more than 200 commercial persons in China which is unique and differentiates the company from its competitors. Revenues grew substantially, and losses have been reduced consequently. BeiGene’s drug candidates have done well in early phase clinical studies. The company looks like a good bet although risks of setbacks, which are typical for biotech firms with a limited product portfolio, remain and should not be lost sight of.
AIS Rating: ★★★★☆
| 2015 | 2016 | 2017 | 2018 Q1 only |
|
|---|---|---|---|---|
| EPS (USDcents) | -6.7 | -3.8 | -2.2 | -2.0 |
| Change | 43% | 42% | -60% |
| P/E | P/E SECTOR |
P/B | P/CF | Equity Ratio* |
ROE | LIAB./ Equity** |
Div YLD |
|---|---|---|---|---|---|---|---|
| n/a | 34 | 8.7 | n/a | 80% | -22% | 26% | n/a |
* Equity / Total Assets, ** Total Liabilities / Equity
[/mepr-active]
