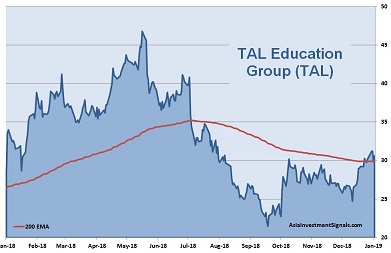
 TAL Education Group (TAL) is the largest public listed education company by market cap in the world. The company offers comprehensive tutoring services to students in China. TAL stands for ‘Tomorrow Advancing Life.’[mepr-active membership=”1734″ ifallowed=”show” unauth=”message” unauth_message=”Please login or purchase a membership to view full text.”]
The tutoring services cover core academic subjects in China’s school curriculum from pre-school to the twelfth grade through three flexible class formats: small classes, personalized premium services, such as one-on-one tutoring, and online courses. The company also operates www.jzb.com, a leading online education platform in China.
TAL Education operates 666 physical learning centers in over 50 key cities in China. Average student enrollments per quarter reached more than 3.2m and almost doubled within a year. While online education services represent less than 10 percent of the company’s revenue, this segment grew by almost 150 percent over the last fiscal year. Educational programs and services, on the other hand, accounted for nearly 90 percent of the revenue but grew by 7 percent only.
TAL Education Group, formerly known as Xueersi, was founded in 2003 and is headquartered in Beijing, China. The company shares trade as ADS on the New York Stock Exchange since 2010 and can also be traded in Germany and Mexico. Major shareholder is the chairman and CEO Mr. Bangxin Zhang with ownership of around 31 percent. 79 percent of the shares are in public hand.
With a workforce of over 28,600 employees, TAL Education reported revenues of 1.8bn USD and net profits of 266m USD over the first nine months of its fiscal year 2018/19. This is an increase of 52 and 111 percent respectively compared to the same period a year ago. In 2017/18, revenues and profits increased by 64 and 73 percent respectively. The operating margin of 12 percent though is below the industry average. TAL Education’s cash reserves increased by 76 percent to 1.3bn USD, while debts increased slightly by 6 percent to 239m USD over the first nine months ending November 2018. The company shows a solid balance sheet with excellent profitability and financial strength. The equity ratio is at 53 percent and the gearing, defined here as total liabilities to total equity, at 89 percent. Next results will be announced the end of April.
After a drop of more than 50 percent within just four months in 2018, TAL Education’s shares shows signs of recovering and just crossed its turning 200 moving average. The shares gained already 15 percent in value this year. The company is priced at 54 times earnings, ten times book value and at 26 times cash flow. No dividends are paid. 11 out of 29 analysts have ‘buy’ recommendations on the stock.
Our Conclusion: The company comes with a robust balance sheet with excellent profitability and financial strength. But the high valuation puts considerable downside risks on the stock. However, the company has on the other hand still much potential to grow with further learning centers and with online learning over the next years. The industry outlook is positive. Education and the future career remains a top priority in the Asian and especially Chinese society. The company is well positioned in an intensely competitive environment and benefits from strong branding as well as scale effects. Revenues and profits grew by impressive 48 and 35 percent annually since IPO in 2010 and do not show signs of fatigue. The company’s projected revenue growth rate of around 34 percent on a year-over-year basis seems conservative. Assuming a more or less stable global economy, we expect the share price to increase another 20 percent this year. High downside risks are present though.
AIS Rating: ★★★☆☆
| 2013/14 | 2014/15 | 2015/16 | 2016/17 | 2017/18 | 2018/19 Q1-3 only |
|
|---|---|---|---|---|---|---|
| EPS (USD) | 0.4 | 0.4 | 0.6 | 0.7 | 1.0 | 1.3 |
| Change | 81% | 8% | 46% | 10% | 56% | 103% |
| P/E | P/E SECTOR |
P/B | P/CF | Equity Ratio* |
ROE | LIAB./ Equity** |
Div YLD |
|---|---|---|---|---|---|---|---|
| 64 | 31 | 9 | n/a | 53% | 19% | 89% | n/a |
* Equity / Total Assets, ** Total Liabilities / Equity
[/mepr-active]
