 BYD Company Ltd (1211.HK) is a Chinese automobile and electronics manufacturing company. The company manufactures traditional fuel vehicles as well as electric cars and buses. BYD is furthermore engaged in the manufacturing of photovoltaic products and rechargeable batteries. It is one of the few electric carmakers with own battery production.[mepr-active membership=”1734″ ifallowed=”show” unauth=”message” unauth_message=”Please login or purchase a membership to view full text.”] BYD also manufactures the Skyrail, a low-carbon and low-cost monorail for urban transportation. A first Skyrail operates since 2017 in Yinchuan, and the company received orders from numerous cities in domestic and overseas markets. Furthermore, BYD manufactures mobile handset components and provides assembly services.
Roughly 90 percent of the revenues are generated in China and Taiwan. BYD’s automotive business accounted for more than half of the revenues and grew by 25 percent over the first six months 2018 compared to the same period a year ago. The mobile handset business accounted for more than a third of the revenues and grew by 11 percent. The rechargeable battery and photovoltaic segment accounted for 8 percent and increased by 22 percent during that period.
BYD is among Forbes’ list of Global 2000 and Growth Champions companies. The company is also part of the Berkshire Hathaway portfolio, the investment vehicle of US billionaire investor Warren Buffett.
BYD was founded in 1995 and is headquartered in headquartered in Shenzhen, China. The company is listed on the Hong Kong’s and Shenzhen’s stock exchanges since 2002 and 2011 respectively. Its shares can also be traded in Germany, UK, Austria, and the US. Major shareholder is the Chairman and CEO, Mr. Wang Chuan-fu with an ownership of around 19 percent, followed by the Vice-chairman, Lv Xiang-yang with an ownership of about 15 percent. Warren Buffett’s Berkshire Hathaway Inc. holds a stake of about 8 percent since 2008. 59 percent of the shares are in public hand.
With a workforce of over 220 thousand employees, BYD reported revenues of 52bn RMB (7.5bn USD) and profits before tax of 1.1bn RMB (156m USD) over its first six months of 2018. This is an increase in revenues of 19 percent but a drop in profits of 59 percent compared to the same period a year ago. In 2017, revenues increased by 2.4 percent while profits declined by 14 percent. The operating margin of 6 percent is slightly below industry average. BYD’s cash reserves increased by 12 percent to 10bn RMB (1.4bn USD), while debts grew by 22 percent to 68.9bn RMB (9.9bn USD) over the first half year 2018. The company shows a stable balance sheet with acceptable profitability and satisfactory financial strength. The equity ratio is at 31 percent and the gearing, defined here as total liabilities to total equity, at high 222 percent. Q3 results will be announced these days.
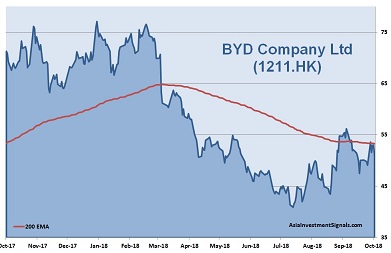
BYD’s shares lost 36 percent from their highs in October 2017. However, the stock regains momentum and is up by 25 percent since early August. A bullish technical signal could come with the crossing of the 200 moving average line. BYD is currently priced at 47 times earnings, two times book value and at 15 times cash flow. The latest dividend yielded only 0.3 percent. 16 out of 25 covering analysts have ‘hold’ and ‘sell’ recommendations on the stock.
Our conclusion: Neither the fundamentals nor the high valuation thrills us currently. More interesting is the fact, that the stock shows relative strength in an overall tumbling market. The crossing of the 200 moving average line could generate further buy signals. The company could also have the potential to grow to a significant player of electrical transportation and batteries in Asia. Revenues and profits rose by 13 and 27 percent respectively over the last five years. China is pushing the transformation towards environmental friendly solutions. Electric cars will play an important role. Other countries in Asia will follow. BYD is worth to be kept on the watchlist.
AIS Rating: ★★★☆☆
| 2013 | 2014 | 2015 | 2016 | 2017 | 2018 H1 only |
|
|---|---|---|---|---|---|---|
| EPS (RMB) | 0.2 | 0.2 | 1.1 | 1.9 | 1.4 | 0.1 |
| Change | 667% | -22% | 522% | 68% | -26% | -78% |
| P/E | P/E SECTOR |
P/B | P/CF | Equity Ratio* |
ROE | LIAB./ Equity** |
Div YLD |
|---|---|---|---|---|---|---|---|
| 48 | 17 | 2.3 | 11 | 31% | 5% | 222% | 0.3% |
* Equity / Total Assets, ** Total Liabilities / Equity
[/mepr-active]
