 Dutech Holdings Limited (CZ4.SI) is a world leading manufacturer of high-security products such as ATM safes, safes for banking, commercial and residential purposes, as well as cash handling systems. The company furthermore manufactures intelligent terminals including ticketing-, vending- and parking machines.[mepr-active membership=”1734″ ifallowed=”show” unauth=”message” unauth_message=”Please login or purchase a membership to view full text.”]
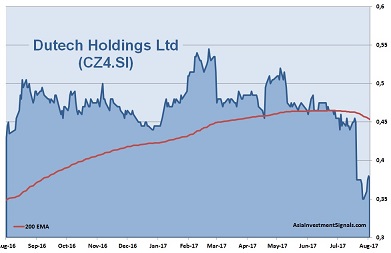
Since our first recommendation last November (see: Dutech Holdings – On Shopping Tour in Germany) the shares have peaked in February this year with a gain of 17%, but then lost around 30% in value due to the integration process of the newly acquired businesses in Europe. The current share price is only five times earnings compared to 19 times among its sector peers. The shares trade well below book value and at four times cash flow only. The last dividend payment yielded almost 3%.
Dutech acquired Krauth Germany, Metric UK and some assets of the insolvent Metric AG Germany last year. With these acquisitions, Dutech has bought know how and a customer base in Europe at reasonable prices to broaden its position in the growing market for intelligent terminals. However, the integration of synergies and the restructuring needs time and will put pressure on Dutech’s profits this year. The company issued a profit warning for the second quarter results. However, the chances are good that Dutech will pick up its growth path again soon. The company has strong R&D capabilities and continues to focus on innovations and value-add product developments.
With a workforce of 655 employees, Dutech reported revenues of 354m RMB (53m USD) and profit before tax of 14m RMB (2m USD) in its first quarter 2017. This is an increase of 32% in revenues, but a decrease of 46% in profits compared to the same period a year ago. In 2016, revenues were up 17% and 7% respectively compared to the year before. The operating margin of 9% is within industry average. Dutech had cash reserves of 272m RMB (41m USD) at the end of March 2017. The company shows a solid balance sheet with an equity ratio of 59% and a gearing, defined here as total liabilities to total equity, of 70%.
Around 60% of the revenues are generated by high-security products. The segment grew a bit over 3% with an operating margin of 18%. The global market for cash handling systems is estimated to grow by more than 10% annually. Driving factors are the growing cash circulation and rising demand for safes and vaults for cash management from cash logistics companies and the increasing security concerns among banks.
Dutech’s revenues with intelligent ticketing and vending machines, on the other hand, grew by 45% in 2016 due to the above-mentioned acquisition of the European companies. The high growth in sales in this segment continued during the first three months of 2017 with a plus of 70%. However, operating margin of 3% in this business segment needs improvement. The global market for self-service machines is estimated to grow between 7% and 9% annually for the next years.
Dutech is UL- and CEN-certified and has manufacturing and service facilities in China, Philippines, Germany, UK, and the US. The company serves multinational customers including European railway companies, international retail chains, companies operating in the public passenger transport, and international industrial companies. Half of Dutech’s revenues are generated in Europe, followed by Asia Pacific (28%) and the US (24%).
Dutech was founded in 2000 and has its headquarter in Shanghai. The company is listed on Singapore’s Stock Exchange since 2007. Shares can also be traded in Germany. Chairman and vice chairman own together almost 60% of the company. 23% of the shares are in public hand.
We are confident that the company will resume its growth path with rising profits towards the end of the year already. The current dip in share prices could be a buying opportunity in view of the next twelve months.
AIS Rating: ★★★★☆
| 2011 | 2012 | 2013 | 2014 | 2015 | 2016 | 2017 Q1 only |
|
|---|---|---|---|---|---|---|---|
| EPS (RMBcents) | 10.2 | 11.3 | 28.2 | 40.6 | 33.1 | 35.4 | 4.3 |
| Change | -44% | 11% | 149% | 44% | -19% | 7% | -17% |
| P/E | P/E SECTOR |
P/B | P/CF | Equity Ratio* |
ROE | Debt/ Equity** |
Div YLD |
|---|---|---|---|---|---|---|---|
| 5 | 19 | 0.8 | 4 | 59% | 16% | 70% | 2.7% |
* Equity / Total Assets, ** Total Liabilities / Equity
[/mepr-active]
