 Spindex Industries Limited (564.SI) is an integrated solution provider in precision engineering. The company manufactures and trades mechanical, electrical and electronic parts as well as precision machine parts and other engineering products.[mepr-active membership=”1734″ ifallowed=”show” unauth=”message” unauth_message=”Please login or purchase a membership to view full text.”]
With manufacturing facilities in China, Malaysia, and Vietnam, Spindex Industries serves MNC customers in the automotive, consumer electronics, imaging and printing, domestic appliances, data storage, machinery, and telecommunication industries.
China accounts for 36 percent of Spindex Industries’ revenues, followed by ASEAN region with 23 percent and other countries including the US and Europe with together 41 percent. The highest growth in revenues last year, with more than 30 percent, was achieved in countries outside Asia.
Spindex Industries’ consumer-related products which include domestic appliances, consumer electronics, data storage, telecommunications, and energy, experienced the strongest growth last year with 42 percent increase in revenues. This segment now makes up almost a third of the company’s sales. Machinery and automotive systems grew by 10 percent and account for almost half of the sales. Only the sale imaging and printing products dropped by 5 percent last year due to a weak global demand.
Spindex Industries prides itself to maintain a flexible manufacturing and an agile organization to continually reconfigure resources to customer’s needs and to integrate into the supply chain of its worldwide customer base. Therefore the company invested in manufacturing sites in proximity to its customers and continuously evaluates new locations to achieve an optimal distribution of its site capacity.
Spindex Industries was founded in 1981 and is headquartered in Singapore. The shares are listed on the main board of Singapore’s stock exchange since 1998. The chairman and his family are today the major shareholders. In an attempt to privatize the company they increased its ownership from 24 percent last year to now more than 72 percent. As the share price is now well above the original offering price of 0.85 SGD, any privatizing and delisting will not be likely soon. 28 percent of the shares are still in public hand.
With a workforce of 527 employees, Spindex Industries reported revenues of 142m SGD (104m USD) and profits before taxes of 17m SGD (13m USD) over its fiscal year 2017 ending in June. This is an increase of 14 percent and 33 percent respectively compared to the same period a year ago. In 2016, revenues increased 9 percent while profits dropped by 14 percent. The operating margin of 12 percent is well above industry average. Spindex Industries had cash reserves of 40m SGD (29m USD) at the end of June 2017 which could be capitalized on new business opportunities. The company shows a solid balance sheet with good profitability and financial strength. The equity ratio is at 70 percent and the gearing, defined here as total liabilities to total equity, at 43 percent.
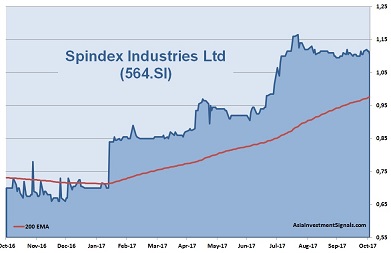
Spindex Industries’ shares are in an uptrend since 2012 and more than quintupled in value since, 53 percent increase alone this year. The company is priced at nine times earnings. The shares trade slightly above book value and at five times cash flow. The company pays only a small dividend yielding less than 3 percent.
Revenues are continually growing since 2011 and earnings per share grew by 15 percent over the last five years. Spindex Industries has an excellent profitability and financial strength, although two major customers account for almost half of the total revenues. With the current moderate valuation of the company and some tailwind from a strong global economy, the share price should increase another 20 to 30 percent in the next six months.
AIS Rating: ★★★★☆
| 2011/12 | 2012/13 | 2013/14 | 2014/15 | 2015/16 | 2016/17 | |
|---|---|---|---|---|---|---|
| EPS (SGD) | 6.2 | 6.1 | 8 | 10.8 | 8.8 | 12.2 |
| Change | 92% | -2% | 32% | 34% | -19% | 39% |
| P/E | P/E SECTOR |
P/B | P/CF | Equity Ratio* |
ROE | LIAB./ Equity** |
Div YLD |
|---|---|---|---|---|---|---|---|
| 9 | 24 | 1.3 | 5 | 70% | 15% | 43% | 2.7% |
* Equity / Total Assets, ** Total Liabilities / Equity
[/mepr-active]