 Samsung SDI Co. Ltd (006400.KS) is a leading manufacturer of rechargeable batteries for the IT industry, electric cars, and energy storage systems. The company furthermore produces cutting-edge materials used to manufacture semiconductors, displays, and solar panels.[mepr-active membership=”1734″ ifallowed=”show” unauth=”message” unauth_message=”Please login or purchase a membership to view full text.”] Samsung SDI is among Forbes’ Global 2000 and Forbes’ 250 Top Multinational Performer companies. The company runs production facilities in Europe, the US and in Asia.
Samsung SDI’s energy solution business, which includes small-sized lithium-ion batteries for mobile phone as well as batteries for automobile and power storage devices, contributes two third to the total revenues and grew by 25 percent in 2017. The company plans to continue expanding this segment actively. The electronic materials segment, which includes semiconductors and display materials, contributes another third to the revenues and increased by 14 percent last year. While the batteries business remains in deficit, the highly profitable electronic materials business more than offset the losses. The chemicals business, which included resin materials and petrochemicals, has been disposed of in 2016.
Samsung SDI was founded in 1970 and is headquartered in Yongin, South Korea. The shares are listed on Korea’s stock exchange and can also be traded in Germany, the US, and the UK. Major shareholder is Samsung Electronics with an ownership of around 20 percent, followed by the National Pension Service of Korea with an ownership of about 9 percent. 73 percent of the shares are in public hand.
With a workforce of over 30,000 employees, Samsung SDI reported revenues of 4,157bn KRW (3.7bn USD) and profits before tax of 339bn KRW (304m USD) during the first half year 2018. This is an increase of 50 and 7 percent respectively compared to the same period a year ago. For the full year 2017, revenues and profits increased by 22 and 200 percent respectively. The operating margin of four percent, on the other hand, is well below industry average and gives room for improvements. Samsung SDI’s cash reserves increased by 8 percent to 1,311bn KRW (1.2bn USD), while debts rose by 38 percent to 1,963bn KRW (1.8bn USD) over the first half year 2018.
Nevertheless, Samsung SDI shows a solid financial strength, despite its weak profitability. The equity ratio is at robust 70 percent and the gearing, defined here as total liabilities to total equity, at 44 percent. Samsung SDI has the second highest credit rating of AA. Next earning results will be announced at the end of October.
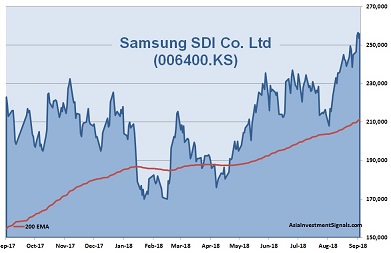
Samsung SDI’s shares are in an uptrend since December 2016 and gained more than 180 percent in value since, 25 percent alone this year. The company is currently priced at 28 times earnings, 1.5 times book value and at 15 times cash flow. The latest dividend yielded only a marginal half percent. 34 out of 36 analysts had a ‘buy’ or ‘outperform’ recommendation on the stock.
Our Conclusion: Samsung SDI comes with robust financial positions. Process automation and economy of scale might help to improve the still weak profitability in the near future as demand for batteries is escalating globally. The valuation of the company is high but justified with a strong underlying growth momentum over the last months. Revenues and profits grew by over 50 percent during the last 12 months. The industry outlook is positive. The market for residential energy storage systems for example, in which Samsung SDI has a leading position with superior technology, is expected to grow at rates of 15 percent until 2020. Assuming a stable global economy, we expect the share price to increase by 15 to 20 percent over the next 12 months.
AIS Rating: ★★★★☆
| 2013 | 2014 | 2015 | 2016 | 2017 | 2018 H1 only |
|
|---|---|---|---|---|---|---|
| EPS (KRW) | 2,957 | -1,458 | 766 | 3,133 | 9,824 | 3,469 |
| Change | -91% | -149% | 153% | 309% | 214% | -15 |
| P/E | P/E SECTOR |
P/B | P/CF | Equity Ratio* |
ROE | LIAB./ Equity** |
Div YLD |
|---|---|---|---|---|---|---|---|
| 28 | 14 | 1.5 | 15 | 70% | 5% | 44% | 0.4% |
* Equity / Total Assets, ** Total Liabilities / Equity
[/mepr-active]