 Xinyi Glass Holdings Limited (0868.HK) is a leading glass manufacturer in the world. The company produces a wide range of glass products such as automobile glass, energy-saving architectural glass, high-quality float glass, electronic glass, and other glass products for commercial and industrial use.[mepr-active membership=”1734″ ifallowed=”show” unauth=”message” unauth_message=”Please login or purchase a membership to view full text.”] The company also produces rubber and plastic components for automobiles. Furthermore, Xinyi Glass has a 30 percent stake in Hong Kong-listed Xinyi Solar Holdings.
More than half of Xinyi Glass’ business comes from float glass products. This segment grew by 5 percent last year. Automobile glass accounted for about 27 percent of the revenue and increased by 9 percent last year. The architectural glass segment generated about 21 percent of the revenue and grew by 20 percent last year. Xinyi Glass’ products are sold in more than 140 countries around the world. Sales in Greater China (including Hong Kong and the PRC) grew by 6 percent last year and accounted for over 70 percent of the revenue. Sales to North America grew by 9 percent and accounted for 10 percent of the revenues. And sales to Europe grew by 18 percent last year but accounted for only 3 percent of the revenue. The company’s production facilities are located in China and Malaysia.
Xinyi Glass was founded in 1988 and is headquartered in Hong Kong. The company is listed on the main board of Hong Kong’s stock exchange since 2005. Its shares can also be traded in Germany, the US, and Switzerland. Major shareholder is the founder and chairman, Dr. Lee Yin Yee, with ownership of around 22 percent, followed by the CEO, Mr. Tung Ching Sai, with an ownership of about 10 percent. Forty-four percent of the shares are in public hand.
With a workforce of more than 11,800 employees, Xinyi Glass reported revenues of 16bn HKD (2bn USD) and profits before tax of 4.97bn HKD (633m USD) in 2018. This is an increase of 9 and 6 percent respectively compared to the same period a year ago. Sales volume increased in all three business segments. In 2017, revenues and profits increased by 15 and 23 percent respectively. The operating margin of 27 percent is well above the industry average. Xinyi Glass’ cash reserves increased by 51 percent to 4.6bn HKD (586m USD), while debts also increased by 18 percent to almost 10bn HKD (1.3bn USD) in 2018.
The company shows a solid balance sheet with good profitability and financial strength. The equity ratio is at 57 percent and the gearing, defined here as total liabilities to total equity, at 75 percent. Moody’s daily credit risk score for Xinyi Glass is five, indicating a medium credit risk, based on the day-to-day movements in market value compared to the company’s liability structure. Next earning results will be announced at the end of July.
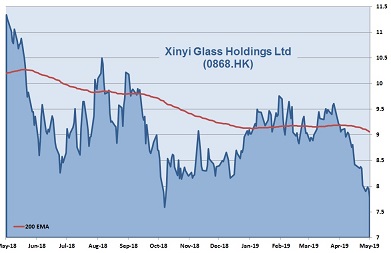
Since its high in March 2018, Xinyi Glass’ shares are in a downtrend and lost more than 40 percent in value since, 8 percent decrease alone this year. The company is priced at seven times earnings, 1.7 times book value, and at seven times operating cash flow. The latest dividend yielded almost 7 percent. 9 out of 10 analysts have a ‘buy’ or ‘outperform’ recommendations on the stock.
Our conclusion: Xinyi Glass shows a solid balance sheet with good profitability and financial strength. The valuation is low compared to its peers and comes with a compounded annual growth rate for revenue and profits of 10 and 14 percent respectively over the last five years. However, the outlook for the automobile and the construction industry in China is turning negative for this year. In addition, the continuing US-China trade dispute also puts pressure on the stock price currently. Nevertheless, the company is well positioned in a strongly competitive environment and has the potential to grow, even in challenging market conditions. Assuming a stable global economy and an end in the US-China trade dispute, we expect the share price to increase at least 20 percent until the end of this year.
AIS Rating: ★★★★☆
| 2013 | 2014 | 2015 | 2016 | 2017 | 2018 | |
|---|---|---|---|---|---|---|
| EPS (HKDcent) | 89 | 35 | 53 | 81 | 100 | 105 |
| Change | 184% | -61% | 54% | 53% | 23% | 5% |
| P/E | P/E SECTOR |
P/B | P/CF | Equity Ratio* |
ROE | LIAB./ Equity** |
Div YLD |
|---|---|---|---|---|---|---|---|
| 7 | 19 | 1.7 | 7 | 57% | 23% | 75% | 6.5% |
* Equity / Total Assets, ** Total Liabilities / Equity
[/mepr-active]
