 Tat Seng Packaging Group Ltd (T12.SI) is one of Singapore’s leading manufacturer of corrugated paper packaging. The company designs and manufactures products for a wide range of industries such as food and beverage, electronics and electrical, pharmaceutical and chemical, plastic and metal stamping as well as other export-related industries.[mepr-active membership=”1734″ ifallowed=”show” unauth=”message” unauth_message=”Please login or purchase a membership to view full text.”] Tat Seng operates a production facility in Singapore and four other plants in China. China accounts for 86 percent of the company’s revenue and grew by 10 percent last year. Singapore accounted for the other 14 percent of the revenue and grew by 13 percent last year. However, only the China operation has been profitable last year, while Singapore remains in deficit.
Tat Seng was founded in 1968 and is headquartered in Singapore. The company is listed on the main board of Singapore’s stock exchange since 2001. Major shareholder is the chairman Dr. Allan Yap and his Spouse, also an executive director of the company, with an ownership of together around 64 percent, followed by the CEO, Mr. Loh See Moon, with an ownership of about 15 percent. About 20 percent of the shares are in public hand.
With a workforce of more than 400 employees, Tat Seng reported revenues of 68.4m SGD (50.2m USD) and profits before tax of 2.9m SGD (2.2m USD) during the first quarter of 2019. This is a decrease of 10 and 57 percent respectively compared to the same period a year ago. For the full year 2018, revenues increased by 10 percent while profits decreased by 6 percent as a result of higher sales and selling prices in China on the one hand, and higher raw material and staff costs on the other hand. The operating margin of 8 percent in 2018 is slightly below industry average and dropped to 5 percent during the first three months of 2019. Tat Seng’s cash reserves decreased by 5 percent to 56m SGD (41m USD), while debts could be reduced by 5 percent to 83m SGD (61m USD) over the first quarter of this year.
The company shows a healthy balance sheet with satisfactory profitability and financial strength. The equity ratio is at 47 percent and the gearing, defined here as total liabilities to total equity, at still acceptable 113 percent. However, Moody’s daily credit risk score for Tat Seng is 8, which stands for high risk, based on the day-to-day movements in market value compared to the company’s liability structure. Next earning results will be announced in early August.
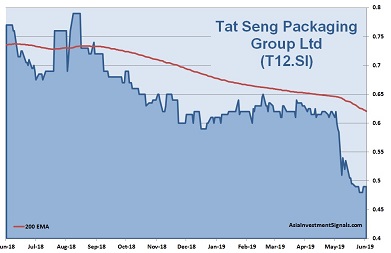
Tat Seng’s shares are in a downtrend since January 2018 and lost around 40 percent in value since, 20 percent alone this year. The company is currently priced at 4.6 times earnings, 0.6 times book value, and at three times operating cash flow. The latest dividend yielded more than 6 percent.
Our conclusion: Tat Seng is struggling with lower profits and operating margins. This is due to the US-China trade dispute and therefore a slowing down China economy, but also due to set up cost for a new factory in China, and higher raw material and staff costs. Nevertheless, higher sales are evidence that the company was able to increase its customer base. The company secured new sales from potential customers and increased also sales from its existing customers in both our China and Singapore markets.
Tat Seng shows still a healthy balance sheet with acceptable profitability and financial strength. The valuation is currently very attractive and comes with a compounded annual growth rate for revenue and profits of 13 and 16 percent respectively over the last three years. The outlook for the global packaging industry is moderately positive with an expected annual growth rate of around 3 percent over the next four years.
Tat Seng is well positioned in a strong competitive environment and shows a capable management, which we believe can steer the company through rough waters. Further process automation will improve operating margins. Assuming a stable global economy and an end of the US-China trade dispute, we expect the share price to see old high again within the next two years.
AIS Rating: ★★★★☆
| 2014 | 2015 | 2016 | 2017 | 2018 | 2019 Q1 only |
|
|---|---|---|---|---|---|---|
| EPS (SGDcent) | 6.0 | 7.9 | 9.2 | 12.9 | 12.3 | 1.5 |
| Change (%) | (20) | 31 | 17 | 40 | (5) | (53) |
| DPS | 0.02 | 0.03 | 0.04 | 0.03 | 0.03 | n/a |
| P/E | P/E SECTOR |
P/B | P/CF | Equity Ratio* |
ROE | LIAB./ Equity** |
Div YLD |
|---|---|---|---|---|---|---|---|
| 5 | 40 | 0.6 | 3 | 47% | 16% | 113% | 6.1% |
* Equity / Total Assets, ** Total Liabilities / Equity
[/mepr-active]