 Sea Limited (SE) is a leading internet platform provider in Greater Southeast Asia with key markets in Indonesia, Taiwan, Vietnam, Thailand, the Philippines, Malaysia, and Singapore. The company’s three businesses, Garena, Shopee, and AirPay, provide digital entertainment, e-commerce, and digital financial services.[mepr-active membership=”1734″ ifallowed=”show” unauth=”message” unauth_message=”Please login or purchase a membership to view full text.”]
Garena operates as a popular online gaming platform and organizes e-sport events in Southeast Asia and Taiwan. The company’s first self-developed online game, Free Fire, has more than 450m registered users and more than 50m daily active users in over 130 countries. Shopee is a leading e-shopping platform and the most downloaded shopping app in Southeast Asia and Taiwan. Indonesia is currently Shopee’s largest market, where it is also the largest e-shopping platform in the country. AirPay is a digital financial services app that provides e-wallet services to consumers.
Shopee grew by 422 percent over the first three months this year and contributed 41 percent to the total revenue. However, the e-commerce business is still the biggest loss-maker in the company. Garena, the digital entertainment segment, grew by 57 percent and contributed 49 percent to the revenue. This segment is currently the only profitable business of the company. The digital financial services segment contributed to only one percent to the revenue. The ‘other’ segment grew by 151 percent but contributed only 10 percent to the total revenue.
Sea, formerly known as Garena Interactive Holding, was founded in 2009 and is headquartered in Singapore. The company is listed on US Nasdaq’s stock exchange since October 2017. Its shares can also be traded in Germany. The major shareholder is Tencent with an ownership of around 33 percent, followed by the founder and CEO, Mr. Forrest Xiaodong Li, with an ownership of about 31 percent. Seventeen percent of the shares are in public hand.
With a workforce of around 10,200 employees, Sea reported revenues of 352m USD and a loss before tax of 682m USD over the first three months of 2019. This is an increase in revenue, but also in losses of 127 percent and 215 percent respectively compared to the same period a year ago. In 2018, revenue and losses increased by 100 and 74 percent respectively. The operating margin remains, therefore, still negative. Sea’s cash reserves increased by 136 percent to 2.4bn USD, while debts have been reduced by 45 percent to 584m USD over the first three months of this year.
The company shows an acceptable financial strength but is still far from being profitable. The equity ratio is at 39 percent and the gearing, defined here as total liabilities to total equity, at high 156 percent. Next earning results will be announced at the end of August.
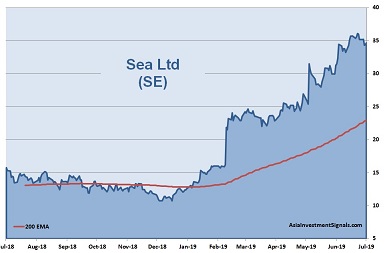
After a long sidewards movement, Sea’s shares are in an uptrend since January 2019 and more than tripled in value since. The company is currently priced at eight times book value. Earning and operating cash flow have remained negative since the IPO. No dividends have been paid so far. Nevertheless, all 11 covering analysts have a ‘buy’ or ‘outperform’ recommendation on the stock.
Our conclusion: Sea is a typical growth company, even not in an early stage anymore. The risks are high, but so are also the opportunities. Much depends on future product developments and trends and also on the company’s ability to grow in an intensely competitive environment. Sea’s revenue grew by 41 percent annually over the last three years. However, profits might not be expected over the next two years at least as costs of marketing will remain high.
Assuming continued stable economic conditions, Sea’s share price could increase another 20 percent this year on strong momentum and the phantasy of future blockbuster products. Something only for very speculative investors!
AIS Rating: ★★★☆☆
| 2015 | 2016 | 2017 | 2018 | 2019 Q1 only |
|
|---|---|---|---|---|---|
| EPS (USD) | (0.6) | (1.3) | (2.7) | (2.8) | (1.9) |
| Change (%) | (106) | (109) | (4) | (191) |
| P/E | P/E INDUSTRY |
P/B | P/CF | Equity Ratio* |
ROE | LIAB./ Equity** |
Div YLD |
|---|---|---|---|---|---|---|---|
| n/a | 32 | 8 | n/a | 39% | n/a | 156% | n/a |
* Equity / Total Assets, ** Total Liabilities / Equity
[/mepr-active]