 Xingfa Aluminium Holdings Limited (0098.HK) is a leading aluminum profiles manufacturer in China. The company produces aluminum profiles for architectural construction and industrial materials. Construction aluminum profiles are used for doors and windows, curtain walls, ceilings and blinds, and other decorative products.[mepr-active membership=”1734″ ifallowed=”show” unauth=”message” unauth_message=”Please login or purchase a membership to view full text.”] Industrial aluminum profiles are mainly plain profiles used for containers, electronic products, and conductive profiles for urban railway locomotives. Xingfa Aluminium is one of the largest suppliers of conductive profiles for metro trains in the world.
Xingfa Aluminium’s construction aluminum segment contributes to around 76 percent to the total revenues and increased by 30 percent over the first six months of this year compared to the same period a year ago. Industrial aluminum profiles contribute to around 22 percent to the revenues but stalled in growth over that same period.
Xingfa Aluminium was founded in 1984 and is headquartered in Foshan, China. The company is listed on Hong Kong’s stock exchange since 2008. Its shares can also be traded in Germany. Major shareholder is the state-owned investment firm Guangdong Guangxin Holdings, with ownership of around 31 percent. Xingfa Aluminium’s CEO, Yuqing Liao, holds about 12 percent in the company. Twenty-six percent of the shares are in public hand.
With a workforce of 8,130 employees, Xingfa Aluminium reported revenues of 4.96bn RMB (708m USD) and profits before tax of 274m RMB (39m USD) over the first six months of 2019. This is an increase of 23 and 33 percent respectively compared to the same period a year ago. For the full year 2018, revenues and profits increased each by around 37 percent. The growth was mainly due to a significant increase in sales orders as a result of successful marketing strategies and the expansion of the sales channels. The operating margin of over seven percent is well above industry average. Xingfa Aluminium’s cash reserves increased by 21 percent to 544m RMB (78m USD), while debts and lease obligations increased by 8 percent to 1.99bn RMB (285m USD) over the first half-year of 2019.
The company has good profitability but just an acceptable financial strength. The equity ratio is at 35 percent and the gearing, defined here as total liabilities to total equity, at 182 percent. Moody’s daily credit risk score for Xingfa Aluminium is five, indicating a medium risk, based on the day-to-day movements in market value compared to the company’s liability structure. Next earning results will be announced at the end of March 2020.
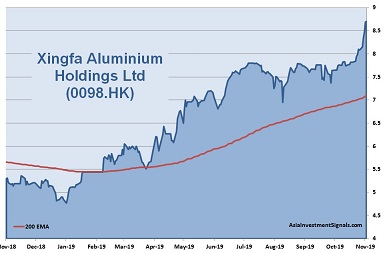
Xingfa Aluminium’s shares are in an uptrend since June 2012 and gained more than 720 percent in value since, 79 percent increase alone this year. The company is currently priced at six times earnings, 1.2 times book value, and roughly three times operating cash flow. The forward dividend yield is 2.3 percent. No analyst is covering the company so far.
Our conclusion: Xingfa Aluminium shows good profitability, but an acceptable financial strength only. The valuation is reasonable and comes with a consistent annual growth rate for both revenue and profit of about 17 percent over the last five years.
In recent years the global demand for aluminum profiles has continuously increased. Xingfa Aluminium sees continuous demand for its aluminum profiles in China but expects also more competition. Further growth opportunities are sought with overseas expansion and with suitable merger and acquisition targets to expand production capacity as well as enhance competitiveness. Also, the setting up of new production facilities outside China is considered to better serve overseas customers.
The company seems to be well-positioned in an intensifying competitive environment. Assuming a stable global economy, we expect the share price to increase another 20 to 30 percent over the next 12 months.
AIS Rating: ★★★★☆
| 2014 | 2015 | 2016 | 2017 | 2018 | 2019 H1 only |
|
|---|---|---|---|---|---|---|
| EPS (RMB) | 0.5 | 0.6 | 0.7 | 0.9 | 1.2 | 0.6 |
| Change (%) | 74 | 19 | 11 | 30 | 28 | 33 |
| DPS (HKD) | 0.09 | 0.09 | – | 0.2 | 0.2 | – |
| P/E | P/E INDUSTRY |
P/B | P/CF | Equity Ratio* |
ROE | LIAB./ Equity** |
Div YLD |
|---|---|---|---|---|---|---|---|
| 6 | 14 | 1.2 | 3 | 35% | 22% | 182% | 2.5% |
* Equity / Total Assets, ** Total Liabilities / Equity
[/mepr-active]
