 HOYA Corporation (7741.T) is a global MedTech company and a leading supplier of innovative high-tech and medical products. In many fields, HOYA is today the No.1 in the world. This includes optical lenses, glass disk for HDDs, photomasks for LCD panels, and mask blanks for semiconductors.[mepr-active membership=”1734″ ifallowed=”show” unauth=”message” unauth_message=”Please login or purchase a membership to view full text.”] With its eyeglass lenses and medical endoscopes, HOYA ranges second in the world. The company has over 150 offices and subsidiaries worldwide. HOYA is among Forbes’ list of Global 2000 companies.
HOYA’s life care segment grew about 6 percent over the first six months of its fiscal year 2019/20 and accounted for about two-thirds of the revenues and 47 percent to the profits. The information technology segment grew by 3 percent and contributed to about one third to the revenues, but 55 percent to the profits. Around one-third of HOYA’s business is generated in Asia-Pacific, another 30 percent in its domestic market Japan. Europe accounts for about 18 percent and the Americas for around 17 percent of the revenues.
HOYA was founded in 1941 and is headquartered in Tokyo, Japan. The company is listed on Tokyo’s stock exchanges since 1961. Its shares also trade in the US and Germany. Major shareholder is the US Fidelity fund with ownership of around 5 percent. HOYA’s CEO, Hiroshi Suzuki, holds just about 0.25 percent in the company. Ninety-five percent of the shares are free float.
With a workforce of over 37 thousand employees, HOYA reported revenues of 295bn JPY (2.7bn USD) and profits before tax of 81.3bn JPY (744m USD) over its first half-year 2019/20. This is an increase of 5 and 10 percent respectively compared to the same period a year ago. Over the full fiscal year 2018/19, which ended in March 2019, revenues and profits increased by 6 and 16 percent, respectively. During the first six months of its current fiscal year, HOYA already reached 52 and 56 percent of its last year’s revenues and profits. The increase is mainly due to the company’s latest acquisitions, as well as the growth in its most competitive product groups. The operating margin (TTM) of 49 percent is among the highest in the industry.
HOYA’s cash reserves increased by 2 percent to 298bn JPY (2.7bn USD), while interest-bearing debts also increased by over 650 percent to 21.5bn JPY (197m USD) over the first half-year ending September 2019. The company shows a solid balance sheet with excellent profitability and financial strength. The equity ratio is at very safe 80 percent and the gearing, defined here as total liabilities to total equity, as low as 25 percent. Moody’s daily credit risk score for HOYA is one, indicating a low risk, based on the day-to-day movements in market value compared to the company’s liability structure. Next earning results will be announced on 4th February.
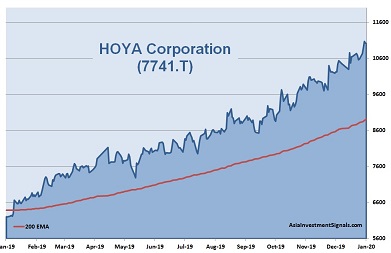
HOYA’s shares are in an uptrend since April 2018 and gained more than 112 percent in value since, 67 percent increase alone since the beginning of 2019. The company is currently priced at 33 times earnings, 6.6 times book value, and at 26 times operating cash flow. The forward dividend yield is less than one percent. 9 out of 14 analysts have a ‘buy’ or ‘strong buy’ recommendations on the stock.
Our conclusion: HOYA shows strong financial positions with excellent profitability and financial strength. The valuation is high and comes with a compounded annual growth rate for both revenue and profits of only 8 percent over the last five years. The global outlook for the med-tech industry is positive, with expected health care spending to rise at 5 percent annually over the next three years. This should present further opportunities for HOYA. The company is well-positioned in an intensely competitive environment and keeps searching for growth opportunities also through acquisitions. Given a stable global economy, we expect the share price to increase another 15 to 20 percent until the end of this year.
AIS Rating: ★★★★☆
| 2014/5 | 2015/6 | 2016/7 | 2017/8 | 2018/9 | 2019/20 H1 only |
|
|---|---|---|---|---|---|---|
| EPS (JPY) | 218 | 225 | 221 | 258 | 321 | 171 |
| Change (%) | 61 | 3 | (1) | 16 | 23 | 9 |
| DPS (JPY) | 75 | 75 | 75 | 90 | 90 | 45 |
| P/E | P/E INDUSTRY |
P/B | P/CF | Equity Ratio* |
ROE | LIAB./ Equity** |
Div YLD |
|---|---|---|---|---|---|---|---|
| 33 | 32 | 6.6 | 26 | 80% | 21% | 25% | 0.8% |
* Equity / Total Assets, ** Total Liabilities / Equity
[/mepr-active]