 Fuji Corporation (6134.T) is a Japan-based international leading manufacturer of robotic mounters and machine tools for the electronic industry. The company is specialized in all areas of a smart factory with high-flexible, high-mix, and high-volume mounting systems for electronic components.[mepr-active membership=”1734″ ifallowed=”show” unauth=”message” unauth_message=”Please login or purchase a membership to view full text.”]
Fuji Corporation operates in three business segments. The robotics solutions segment, which includes robotic mounters and semiconductor manufacturing equipment mainly for the communication and the computer industry, contributes 92 percent to the total revenue and is currently the only profitable segment. Revenue of this segment decreased slightly by 2 percent in the past fiscal year. China is the largest geographic market for this segment with a revenue share of 56 percent, followed by other Asian countries with 24 percent. The machine tools segment contributes only 6 percent to the revenue and decreased by 27 percent last year. Japan is the largest geographic market for this machine tools segment with a revenue share of 45 percent, followed by the US with 22 percent. The ‘others’ segment, comprising of control and electronic equipment and image processing development, contributes just 2 percent to the total revenue.
Fuji Corporation (formerly known as Fuji Machine Mfg. Co.) was founded in 1959 and is headquartered in Chiryu, Japan. The company is listed on the first section of Tokyo’s stock exchange since 2013. Its shares can also be traded in Germany and the US. The eight board members hold less than 0.05 percent of the company. About 83 percent of the shares are in public hands.
With over 2,500 employees, Fuji Corporation reported revenues of 136bn JPY (1.2bn USD) and profits before tax of 24bn JPY (220m USD) in its fiscal year 2020/21. This is a decrease of 3 percent in revenue, but an increase of 16 percent in profits compared to the same period a year ago. In 2019/20, revenues were up by 9 percent while profits down by 12 percent. The operating margin of 14 percent is well above the industry average. Fuji Corporation’s cash reserves increased by 38 percent to 60bn JPY (550m USD) at the end of its fiscal year 2020/21. The company has no debts and lease obligations.
Fuji Corporation shows a solid balance sheet with good profitability and financial strength. The equity ratio is 88 percent, and the gearing, defined here as total liabilities to total equity, as little as 13 percent. The next earning results will be announced in early August.
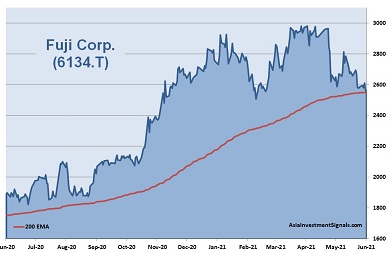
Fuji Corporation’s shares are in an uptrend since May 2019 and more than doubled in value since. The company is currently priced at 16 times earnings, 1.2 times book value, and seven times operating cash flow. Dividends yield a bit more than 1.6 percent. 4 out of 5 analysts currently have a ‘buy’ or ‘outperform’ recommendations on the stock with an average target price of 3665 JPY.
Our conclusion: Fuji Corporation shows a healthy balance sheet with good profitability and financial strength. The valuation is reasonable and comes with a compounded annual growth rate for revenue and profits of 19 and 30 percent, respectively, over the last three years. The global smart factory market outlook is positive, with an expected growth rate of 10 percent over the next five years. Digitization in the industry has made a great leap forward, partly due to the pandemic. Companies increasingly trust artificial intelligence and robotics. Fuji Corporation has excellent potential in accelerating innovation for autonomous robotics and is well-positioned in a strong competitive environment. Assuming a stable global economy, we expect the share price to increase 15 to 20 percent over the next 12 months.
AIS Rating: ★★★★☆
| 2015/16 | 2016/17 | 2017/18 | 2018/19 | 2019/20 | 2020/21 | |
|---|---|---|---|---|---|---|
| EPS (JPY) | 74 | 71 | 182 | 175 | 155 | 178 |
| Change (%) | (16) | (4) | 157 | (4) | (11) | 15 |
| DPS (JPY) | 28 | 30 | 40 | 50 | 50 | 50 |
| P/E | P/E INDUSTRY |
P/B | P/CF | Equity Ratio* (%) |
ROE (%) |
LIAB./ Equity** (%) |
Div YLD (%) |
|---|---|---|---|---|---|---|---|
| 16 | 26 | 1.2 | 7 | 88 | 9 | 13 | 1.6 |
* Equity / Total Assets, ** Total Liabilities / Equity
[/mepr-active]