 Since their highs in January, most Asia-Pacific stock markets are tumbling. The MSCI Asia-Pacific Index is down by 7 percent this year. China’s stock market is the worst performing in Asia-Pacific with a decline of almost 19 percent so far. [mepr-active membership=”1734″ ifallowed=”show” unauth=”message” unauth_message=”Please login or purchase a membership to view full text.”] Moreover, India, the best performing market in Asia-Pacific this year with an increase of 12 percent, doesn’t look good on a second glance. The India Rupee is down 14 percent against the USD and eats up all profits of a foreign investor.
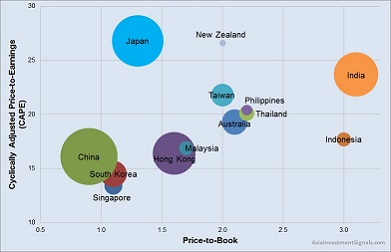
The reason for the decline in APAC markets can be read in many news: Trump’s trade war with China, rising interest rates in the US with the effect of a strengthening US dollar, trade balance deficits and high USD debts in many emerging market countries led to the fact that foreign investors pulled out their money from those markets. However, a look at the valuation of the single markets around Asia-Pacific shows that many are far from being overpriced. Our graph shows the valuation map for the different stock markets in Asia-Pacific. The vertical axis of the graph shows the CAPE ratio. The horizontal axis shows the price-to-book ratio. The size of the bubbles indicates the market capitalization in USD of each country.
The Cyclically Adjusted Price-Earnings (CAPE) ratio, also known as the Shiller or P/E10 ratio, sets the current price of a country’s market index in relation to the average inflation-adjusted earnings over the last ten years of the constituents companies in that index. The price-to-book ratio (PB) puts the price of a country’s market index in relation to the accumulated and averaged book values of all companies included in that index.
Although both indicators have limited predicting power over a short and mid-term period, they can nevertheless provide an informative snapshot of the market condition in the country. Moreover, rather than indicating the potential returns in the future, the graph can give some hints for downside risks inherent in these markets. The relevance of both indicators increases with the size of the market capitalization of the country.
A look at the graph shows that Singapore has still the most favorable valuation currently regarding companies’ earnings and assets. Singapore’s CAPE and PB ratio, 13.4 and 1.1 respectively, are among the best in Asia-Pacific. Reasonably priced is also the South Korean stock market with a CAPE ratio of 14.5 and a PB ratio of 1.1. Japan, in contrast, is a market where the valuation of the aggregated company earnings is quite high with a CAPE ratio of 26.8, while the aggregated company assets are priced at 1.3 times book value only. Thailand, Taiwan, Philippines, India and New Zealand are markets valued at 20 and more times company earnings and two or more times company assets. Indonesia’s and India’s aggregated company assets are even priced as high as three times and more.
In comparison, the US stock market has a CAPE ratio of 32.1 and a PB ratio of 3.4. The gap between the US and Asia-Pacific markets is considerably and might narrow again at some point in time. The question remains from which side the gap will close and when.
It is vital for an investor to keep a look at the valuation of the overall market of each country. While it can be a smart move to buy index funds in countries with a low valuation, it is more and more important to apply a careful stock picking in markets with a high valuation.
The CAPE and other country valuation ratios are regularly published along with further research by Starcapital AG.
[/mepr-active]
