 ANTA Sports Products Ltd (2020.HK) is China’s largest sportswear producer by market value. The company has transformed itself from a producer of no-frills sports shoes and apparels for the mass market to a premium brand sportswear company in China.[mepr-active membership=”1734″ ifallowed=”show” unauth=”message” unauth_message=”Please login or purchase a membership to view full text.”] Today, the brand portfolio includes the ANTA core brand, the Italian-South Korean brand FILA, the Japanese brand DESCENTE, as well as the brands SPRANDI, KINGKOW, and KOLON SPORT. With its multi-brand and omni-channel strategy, ANTA Sports aims the potential of both, the mass and the high-end sportswear markets in China. The company is currently also a leading investor for the acquisition of the Finnish sportswear maker Amer Sports Oyj, whose portfolio includes brands such as Wilson, Salomon, Atomic, Mavic, and Suunto. Interest in winter sports is on the rise as China will host the Winter Olympics in 2022. ANTA Sports is also part of Forbes Asia’s Fab 50 companies.
ANTA Sports’ apparels business contributes to 61 percent to the revenue, while footwear makes up 36 percent. The company posted its fifth year of double-digit growth and record income and plans to increase its number of outlets to about 12,670 this year. ANTA Sports expects sales to grow by 15 to 20 percent per year until 2020 with the FILA brand accounting for more than 30 percent of sales by then.
ANTA Sports was founded in 1994 and is headquartered in Quanzhou, China. The company is listed on the main board of Hong Kong’s stock exchange since 2007. Its shares can also be traded in Germany, the US, and in Mexico. Major shareholder is Anta International Group Holdings Ltd, the owner’s family investment arm, with ownership of around 51 percent. About 39 percent of the shares are in public hand.
With a workforce of almost 19 thousand employees, ANTA Sports reported revenues of 24.1bn RMB (3.6bn USD) and profits before tax of 5.8bn RMB (862m USD) over the year 2018. This is an increase of 44 and 34 percent respectively compared to the same period a year ago. In 2017, revenues and profits increased by 25 and 30 percent respectively. The operating margin of around 24 percent is well above industry average. ANTA Sports’ cash reserves increased by 33 percent to 9.3bn RMB (1.4bn USD), while debts also increased to 1.3bn RMB (196m USD) over the year 2018. The company shows a solid balance sheet with good profitability and financial strength. The equity ratio is at 68 percent and the gearing, defined here as total liabilities to total equity, at 48 percent. Moody’s credit risk score for ANTA Sports is 7 out of 10, which stands for higher credit risks based on the day-to-day movements in market value compared to the company’s liability structure. Next earnings results will be announced mid of August.
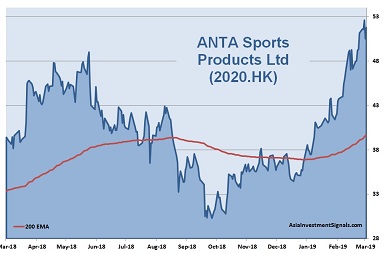
ANTA Sports’ shares are in an uptrend since 2012 and gained more than twelvefold in value since. Nevertheless, shares declined more than one third between June and October last year due to allegations about accounting practices. Shares are now back on track since last October and increased by 38 percent alone this year. The company is currently priced at 29 times earnings, eight times book value and at 28 times cash flow. The latest dividend yielded roughly two percent. 26 out of 32 analysts had ‘buy’ or ‘outperform’ recommendations on the stock.
Our conclusion: ANTA Sports shows a robust balance sheet with excellent profitability and financial strength. The company is well positioned in a strong competitive environment due to its multi-brand and omni-channel strategy. Revenues and profits grew by more than 20 percent over the last five years. However, valuation is high, and price/earnings to growth ratio are at 1.4 currently. Price/earnings ratio is not expected to go below 20 before 2021. Assuming a stable global economy, the share price could increase another 10 to 15 percent this year but comes with high downside risks.
AIS Rating: ★★★☆☆
| 2013 | 2014 | 2015 | 2016 | 2017 | 2018 | |
|---|---|---|---|---|---|---|
| EPS (RMBcents) | 52.6 | 68.9 | 81.5 | 95.2 | 116.8 | 152.7 |
| Change | -3% | 29% | 20% | 17% | 23% | 31% |
| P/E | P/E SECTOR |
P/B | P/CF | Equity Ratio* |
ROE | LIAB./ Equity** |
Div YLD |
|---|---|---|---|---|---|---|---|
| 29 | 19 | 8 | 28 | 68% | 28% | 48% | 1.8% |
* Equity / Total Assets, ** Total Liabilities / Equity
[/mepr-active]
