 Venture Corp Ltd (V03.SI) is a leading global provider of manufacturing, engineering, design and fulfillment services to the electronics industry. The company which once started with simple assembly works has today a portfolio of more than 5,000 products ranging from medical devices to communications equipment.[mepr-active membership=”1734″ ifallowed=”show” unauth=”message” unauth_message=”Please login or purchase a membership to view full text.”] Venture Corp serves around 150 clients and ranks among the best in managing the value chain for leading electronics companies, including many Fortune 500 corporations.
Venture Corp’s electronics manufacturing services business accounts for around 77 percent of the revenues and has been the fastest growing segment with a rate of 50 percent in 2017. The retail store and industrial business contributed to around 20 percent of the revenues and increased by 11 percent last year. Venture Corp’s third segment, components technology, grew by 20 percent but contributed to only three percent to the revenues. Around 20 percent of the sales are generated in Singapore, another 75 percent in the rest of Asia-Pacific.
Venture Corp was founded in 1984 and is headquartered in Singapore. The shares are listed on the main board of Singapore’s stock exchange since 1992 and are today constituent of the STI index. Venture Corp’s shares can also be traded in Germany and the US. The chairman and CEO, Mr. Wong Ngit Liong, has a stake of around 7 percent in the company. 91 percent of the shares are in public hand.
With a workforce of over 12,000 employees, Venture Corp reported revenues of 856m SGD (639m USD) and profits before tax of 99m SGD (74m USD) over the first quarter of 2018. This is an increase of 2 and 64 percent respectively compared to the same period a year ago. A weakening USD during that period has been responsible for the almost flat revenue growth, which would have grown by 9 percent otherwise. For the full year 2017, revenues and profits increased by 39 and 106 percent respectively. The operating margin of 12 percent is below industry average and leaves room for improvements. Venture Corporation’s cash reserves were at 738m SGD (551m USD) at the end of March 2018. The company shows a robust balance sheet with good profitability and financial strength. The equity ratio is at 73 percent and the gearing, defined here as total liabilities to total equity, at 38 percent. Next results will be announced early August.
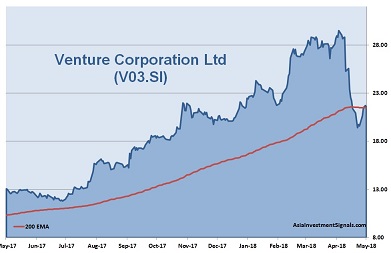
Venture Corp’s shares increased by more than 250 percent since 2016 and peaked in April. Since then, the shares lost around a third in value. Looks familiar? We have seen a similar development with the shares of Valuetronics. Both companies operate in the same sector. Moreover, as in the case of Valuetronics with its primary customer Philips, Venture Corp depends strongly on one customer too who makes up for more than 10 percent of the total revenue. Rumors point to Philip Morris International who is responsible for even 30 percent of Venture Corp’s revenues. This makes the company vulnerable to negative news from such clients as happened in the case of Philip Morris who reported disappointing sales in Japan recently. Venture Corp became the target of short-seller attacks subsequently.
Venture Corp is priced at 15 times earnings. The shares trade at 2.7 times book value and at 13 times operating cash flow. The latest dividend yielded more than two percent. The majority of covering analysts recommend buying the stock.
The company shows a healthy balance sheet with good profitability and financial strength. Venture Corp is a strong player and well positioned in a competitive environment. Revenues and profits grew by more than 40 percent over the last three years. But the company needs to keep the pace to justify the still high valuation, even after the recent sell-off. That makes an investment riskier than in Valuetronics currently.
AIS Rating: ★★★☆☆
| 2013 | 2014 | 2015 | 2016 | 2017 | 2018 Q1 Only |
|
|---|---|---|---|---|---|---|
| EPS (SGDcents) | 47.7 | 27.7 | 55.6 | 64.8 | 130 | 28.8 |
| Change | -6% | -42% | 101% | 17% | 101% | 67% |
| P/E | P/E SECTOR |
P/B | P/CF | Equity Ratio* |
ROE | LIAB./ Equity** |
Div YLD |
|---|---|---|---|---|---|---|---|
| 15 | 12 | 2.7 | 13 | 73% | 20% | 38% | 2.3% |
* Equity / Total Assets, ** Total Liabilities / Equity
[/mepr-active]
