 Hitachi Ltd (6501.T) is a Japanese multinational conglomerate corporation that operates eight business segments: IT, Energy, Industry, Mobility, Smart Life, Automotive Systems, Construction Machinery, Metals, and others. The company is ranked 133rd on the latest Forbes Global 2000 list.
Over the last fifteen years, Hitachi strongly reduced the number of its listed group companies and consolidated subsidiaries through restructuring and sell-offs. The company plans to become a specialist in IT and infrastructure maintenance in the near future.[mepr-active membership=”1734″ ifallowed=”show” unauth=”message” unauth_message=”Please login or purchase a membership to view full text.”]
Today, the IT business is Hitachi’s most important segment, accounting for 20 percent of revenues and 25 percent profit. The Smart Life segment follows with 11 percent to the revenues but 22 percent to the profit. The most substantial growth experienced the Automotive Systems and the Energy segment with 134 and 69 percent, respectively. Japan remains the company’s primary market for Hitachi with 40 percent of its revenues, followed by the rest of Asia, including China, with another 26 percent.
Hitachi was founded in 1910 and is headquartered in Tokyo, Japan. The company has been listed on Tokyo’s and Nagoya’s stock exchange since 1949 and is today a constituent of the Nikkei 225 and TOPIX Core30 indices. The shares can also be traded in the US, Germany, Mexico, and Austria. The largest shareholder is Asset Management One Co., Ltd., with ownership of around four percent. Hitachi’s management holds less than 0.03 percent of the shares. Ninety-five percent of the shares are in public hands.
With over 350 thousand employees, Hitachi reported revenues of 4.8tn JPY (42bn USD) and profits before tax of 420bn JPY (3.7bn USD) over the first half of its fiscal year 2021/22. This is an increase of 29 and 9 percent respectively compared to the same period a year ago. Revenues stalled over the full FY 2020/21 while profits increased 369 percent. The operating margin of a little over 6 percent is only roughly higher than the industry average. Hitachi’s cash reserves decreased by 13 percent to 881bn JPY (7.7bn USD), while debts and lease obligations increased by 38 percent to 3.3tn JPY (29bn USD) over the first half FY 2021/22 ending of September 2021.
The company still shows a stable balance sheet with acceptable profitability and financial strength. The equity ratio is at 37 percent, and the gearing, defined here as total liabilities to total equity, is at a high 171 percent. Moody’s current rating of Hitachi is A3, with a negative outlook due to declining margins and rising debts. Moody’s daily credit risk score is at 6, indicating a medium risk, based on the day-to-day movements in market value compared to the company’s liability structure. The next earning results will be announced in February 2022.
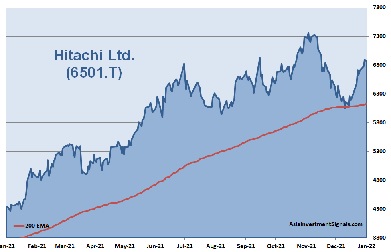
Hitachi’s shares have been in an uptrend since November 2020 and almost doubled in value since, 10 percent increase alone in the first two weeks of this year. Currently, the company is priced at 12 times earnings, 1.7 times book value, and nine times operating cash flow. The forward dividend yields more than 1.7 percent. 12 out of 14 covering analysts have a ‘buy’ or ‘outperform’ recommendations on the stock with an average target price of 8,052 JPY, a potential 17 percent increase.
Our conclusion: Hitachi still shows a stable financial position with acceptable profitability and financial strength. The valuation is reasonable. Despite flat revenue growth, the company shows signs of improving profitability due to its continuing restructuring efforts. The outlook for many of Hitachi’s segments is positive. We expect the share price to increase another 10 to 15 percent this year, assuming continued stable economic conditions.
AIS Rating: ★★★☆☆
| 2016/17 | 2017/18 | 2018/19 | 2019/20 | 2020/21 | 2021/22 HY only |
|
|---|---|---|---|---|---|---|
| EPS (JPY) | 48 | 376 | 230 | 91 | 519 | 333 |
| Change (%) | 34 | 684 | (39) | (61) | 472 | 29 |
| DPS (JPY) | 13 | 15 | 90 | 95 | 105 | n/a |
| P/E | P/E INDUSTRY |
P/B | P/CF | Equity Ratio* (%) |
ROE (%) |
LIAB./ Equity** (%) |
Div YLD (%) |
|---|---|---|---|---|---|---|---|
| 12 | 14 | 1.7 | 9 | 37 | 17 | 171 | 1.7 |
* Equity / Total Assets, ** Total Liabilities / Equity
[/mepr-active]